Raman Spectroscopy of Proteins
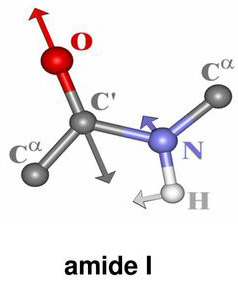
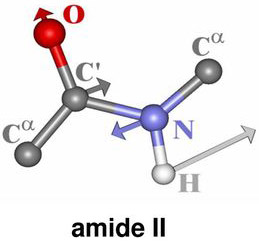
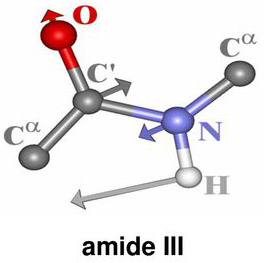
Secondary structure characteristics of proteins can be determined effectively using Raman spectroscopy[1-5]. The correlation between the Raman band frequency and the secondary structure of the protein arises from the fact that the hydrogen bonding of the polypeptide bond is different in α-helix, β-sheet, or disordered structures. The Raman bands that are related to the peptide linkage (O–C–N–H) are designated as the amide bands based on the normal mode calculation of a model compound N-methylacetamide for peptide bond[2]. Nine normal modes are allowed for the amide band of proteins. These are called A, B, and I-VII in order of decreasing frequency. Amide I band is 80% of C=O stretch, near 1650cm-1 . While Amide II band is 60% of N–H bend and 40% C–N stretch and located near 1550 cm-1. Amide III band is 40% of C–N stretch, 30% of N–H bend and positioned near 1300 cm-1.
Figure 1. Vibrational modes of the peptide bond
These features are the key characteristic bands of the protein secondary structure and are summarized in Table 1.
Table 1. Correlation between Raman shift and protein secondary structure.
Raman Shift (cm-1) | Protein Backbone | Secondary Structure Motif |
1670-1680 | Amide I | ß-Turn/random ß-space |
1660-1670 | Amide I | ß-sheet |
1650-1655 | Amide I | α-helix |
1330-1340 | Amide III | α-helix |
1235-1250 | Amide III | ß-sheet |
930-950 | Skeletal stretch | α-helix |
Quantitative analysis of the secondary structure components from Raman based on several secondary structural determination algorithms:
- Band deconvolution of a specifically information-rich spectral feature known as the Amide I band[6]
- Multivariate modeling approach that incorporates a broad spectral range from 990 cm-1 to 1730 cm-1.
Raman spectroscopy can be used to probe for tertiary structure of proteins with the help of such spectral features in proteins spectra as disulphide bridges (S-S bonds) and aromatic amino acids (phenylalanine – Phe, tryptophan – Trp, tyrosine – Tyr, hystidin – His).
The disulfide bond is a covalent bond between sulfur units on cysteine residues, and is crucial for maintaining the native protein structure. Table 2 shows three unique disulfide bond conformers.
Table 2. Summary of Raman bands frequencies of the sulfhydryl in different hydrogen bonding status and of disulfide bond in different conformers[7-12]
| Band Frequency (cm-1) | Vibrational Mode | Local Environment and Conformers |
| >2585 | Free S–H stretch | Exposed |
| 2575 | Weakly H-bonded | Partially exposed |
| 2565 | Moderately H-bonded | Partially exposed |
| <2560 | Strongly H-bonded | Buried |
| 704 | C–S stretch | Trans conformer |
| 655 | C–S stretch | Gauche conformer |
| 508-512 | S-S stretch | GGG conformer |
| 523-528 | S-S stretch | GGT conformer |
| 540-545 | S-S stretch | TGT conformer |
Some of the vibrational bands of Tyr, Trp or Phe are sensitive to the microenvironment (see Table 3). Theirs band positions may vary up to 5 cm-1 in the Raman spectra of proteins.
Table 3. Raman modes of aromatic amino acids within the protein structure[13-14]
Aromatic Residues | Band Frequency (cm-1) |
Phe | 620 |
Tyr | 640 |
Trp | 750 |
Tyr | 830, 850 |
Phe | 1000, 1030 |
Trp | 1011 |
Tyr, Phe | 1170-1200 |
Trp | 1340-1360 |
Trp | 1582 |
Phe, Trp | 1584 |
Tyr | 1590 |
Phe | 1605 |
Trp, Phe, Tyr | 1610-1616 |
Trp | 1618-1621 |
His | 3110-3160 |
The unfolding and misfolding of protein structure are a central concern in maintaining protein pharmaceutical stability and activity. The denaturation of native protein structure, misfolding and then aggregation often involve a change in the secondary structure. Raman spectroscopy is particularly suited to characterize the transformation of native protein structure to protein aggregates. It also essential for monitoring of proteins environment due to changes in pH, temperatures, solvents.
References:
- Tu AT., (1982), Raman Spectroscopy in Biology: Principles and Application, New York: Wiley
- Krimm, S., Bendekar, J., (1986), Vibrational spectroscopy and conformation of peptides, polypeptides and proteins, Adv. Protein Chem., 38:81–364. 44
- William, RW., (1986), Protein secondary structure analysis using Raman Amide I and Amide III spectra, Method Enzymol., 130:311–331. 45
- Thomas, GJ., Jr., (1999), Raman spectroscopy of protein and nucleic acid assemblies, Annu. Rev. Biophys. Biomol. Struct., 28:1–27. 46
- Tuma, R., (2005), Raman spectroscopy of proteins: from peptides to large assembles, J. Raman Spectrosc., 36:307–319
- William, RW., (1986), Protein secondary structure analysis using Raman Amide I and Amide III spectra, Method Enzymol., 130:311–331
- Li, H., Thomas, GJ., Jr,. (1991), Cysteine conformation and sulfhydryl interactions in proteins and viruses. 1. Correlation of the Raman S–H band with hydrogen bonding and intramolecular geometry in model compounds. J Am Chem Soc 113: 456–462. 67
- Li, H., Wurrey, CJ, Thomas, GJ., Jr., (1992), Cysteine conformation and sulfhydryl interactions in proteins and viruses. 2. Normal coordinate analysis of the cysteine side chain in model compounds, J Am Chem Soc, 114:7463–7469
- Sugeta, H., Go, A., Miyazawa, T., (1973), Vibrational spectra and molecular conformations of dialkyl disulfides, Bull Chem Soc Jpn, 46:3407– 3411
- Sugeta, H., (1975), Normal vibrations and molecular conformations of dialkyl disulfides, Spectrochim Acta, 31A:1729–1737
- Van Wart, H.E., Lewis, A., Scheraga, A., Saeva, FD., (1973), Disulfide bond dihedral angles from Raman spectroscopy, Proc Natl Acad Sci USA, 70:2617– 2623
- Van Wart, H., Scheraga, HA., (1986), Agreement with the disulfide stretching frequency-conformation correlation of Sugeta, Go and Miyazawa. Proc Natl Acad Sci USA 83:3064–3067
- Wen, ZQ, Thomas, GJ., Jr., (2000), Ultraviolet resonance Raman spectroscopy of the filamentous virus Pf3: interaction of Trp 38 specific to the assembled virion subunit, Biochemistry, 39:146– 152
Harada, I., Miura, T., Takeuchi, H., (1986), Origin of the doublet at 1360 and 1340 cmS1 in the Raman spectra of tryptophan and related compounds, Spectrochim Acta A, 42:307–312