Circular dichroism (CD)
Principles of CD measurements
Circular dichroism (CD) is a type pf spectroscopy in which the degree of absorption of left and right circularly polarized light is different in the absorption wavelength range of optically active substances. CD measurements detect these differences by passing left and right circularly polarized light through an optically active sample. The transmitted light is then elliptically polarized, and this phenomenon is called circular dichroism (CD) and is expressed by the ellipticity θ. A plot of the wavelength dependence of this ellipticity is called a circular dichroism spectrum (CD spectrum).
Linear polarization is obtained by passing light through an optical element (polarizer) in which the crystal axes and the orientation of the molecules are aligned. Circular polarization occurs when the phase of an orthogonal wave vector (electric field vector) deviates by 1/4 wavelength. Circularly polarized light can be left-handed (El) and right-handed (Er), and linearly polarized light can be treated as the sum of E l and E r of equal intensity. When E l and E r have different intensities, the resulting light is referred to as elliptically polarized (Figure 1).
Optically active substances are molecules that have mirror images with L- and D-forms. Examples of such molecules are thalidomide and glyceraldehyde. Such substances cause a rotation of the polarization plane of linearly polarized light, referred to as optical rotation (OR).
Figure 1.
(A) Sum of circularly polarized light and linearly polarized light. Unequal absorption of circularly polarized light;
(B) Unequal absorption of circularly polarized light

CD measurements of proteins and peptides
The phenomenon of circular dichroism is very sensitive to the secondary structure of polypeptides and proteins (Figure 3, 4 and 5). It has been shown that CD spectra between 260 and approximately 180 nm can be analyzed for the different secondary structural types: alpha helix, parallel and antiparallel beta sheet, turn, and other. A number of excellent review articles are available describing the technique and its application[1,2]
Proteins adopt unique conformations, optimized to perform specific structural, regulatory or enzymatic functions. Therefore, the information on the protein structure is paramount to elucidating how proteins function. The far-UV (180-250 nm) region probes the peptide backbone chain, whose phi and psi angles rotate depending on the protein conformation. There are two absorption bands which make up the far-UV CD spectrum: a strong p à p* around 190 nm and a weaker but broader n à p* transition between 210-220 nm, seen in (Figure 2).
Figure 2. The peptide bond (top) and the corresponding UV transitions observed in the far-UV CD spectrum (bottom).
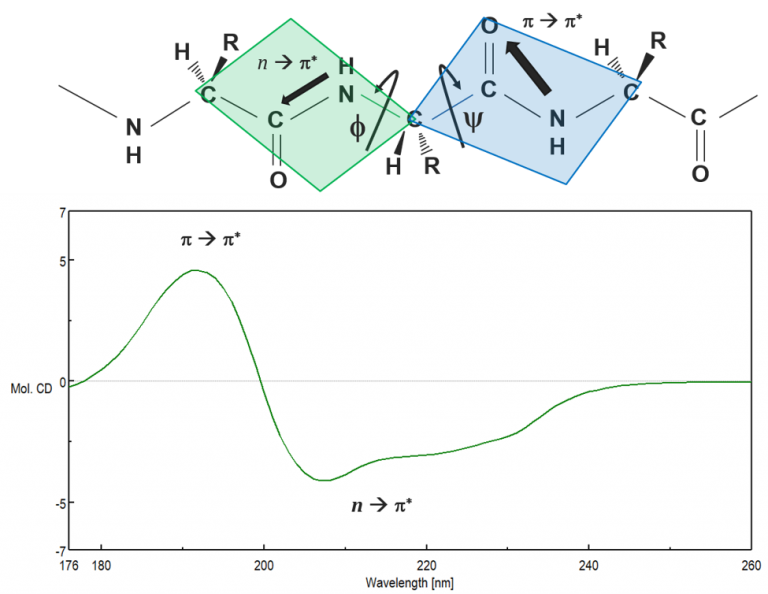
Figure 3. A) triosephosphate isomerase (H:0.52, S:0.14, T:0.11, O:0.23); B) hen egg lysozyme (H:0.36, S:0.09, T:0.32, O:0.23); C) myoglobin (H:0.78, S:0.0, T:0.12, O:0.10); and D) chymotrypsin (H:0.10, S:0.34, T:0.20, O:0.36). Secondary structures are color coded red: α-helix. green: β-strand, and yellow: other.
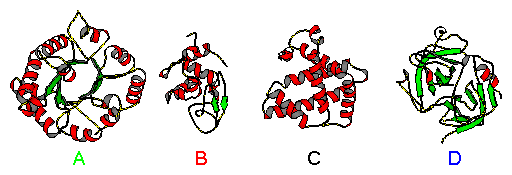
Figure 4. Circular dichroism spectra of triosephosphate isomerase (H:0.52, S:0.14, T:0.11, O:0.23), hen egg lysozyme (H:0.36, S:0.09, T:0.32, O:0.23), myoglobin (H:0.78, S:0.0, T:0.12, O:0.10), and chymotrypsin (H:0.10, S:0.34, T:0.20, O:0.36).
Figure 5. Circular dichroism spectra of “pure” secondary structures[4]
Modern secondary structure determination by CD are reported to achieve accuracies of 0.97 for helices, 0.75 for beta sheet, 0.50 for turns, and 0.89 for other structure types [3]. In fact, optical rotary dispersion (ORD) data suggests a right-handed helical conformation as a major protein structural element. Modern secondary structure determination by CD are reported to achieve accuracies of 0.97 for helices, 0.75 for beta sheet, 0.50 for turns, and 0.89 for other structure types[3].
For secondary structure determination, several methods have been developed which analyze the experimental CD spectra using a database of reference protein CD spectra containing known amounts of secondary structure [1,5,6,7] .
For successful secondary structure analysis the following requirements should be fulfilled: CD spectra need to be recorded from about 260 nm to at least 184nm (and preferable 178 or below)[1] and an accurate protein concentration (< 10% error) is essential. Circular dichroism spectroscopy has also been used to determine the tertiary structure class of globular proteins. This method [8] claims 100% accuracy for predicting all alpha, alpha/beta, and denatured proteins; 85% for alpha + beta; and 75% for all beta proteins.
Circular dichroism spectroscopy has been extensively applied to the structural characterization of peptides. The application of CD for conformational studies in peptides (like proteins) can be largely grouped into a) monitoring conformational changes (e.g., monomer-oligomer, substrate binding, denaturation, etc.) and b) estimation of secondary structural content (e.g., this peptide is 25% helical under these conditions). As already mentioned, CD is particularly well-suited to determine structural changes in both proteins and peptides. However, absolute structural content is more difficult and is prone to over-interpretation. Length-dependencies of the CD spectra of “pure” secondary structures are only one potential caveat.
The CD spectra of peptides have been reported in a number of solvent systems. The helix-promoting characteristics of trifluoroethanol (TFE) and hexafluoroisopropanol (HFIP) are well-known. It is believed that these solvents mimic a particular characteristic of the in vivo system and therefore attach relevance to structural studies performed in these solvents. It was demonstrated [9] that peptide sequences could be induced to form alpha helices or beta strands in TFE and non-micellar SDS solutions, respectively, regardless of their secondary structure in the native protein. This result underscores the difficulties in assigning relevance to structural studies in peptides using CD spectroscopy.
References:
- W. Curtis Johnson Jr., Protein secondary structure and circular dichroism: A practical guide, (1990), Proteins, Volume7, Issue3, Pages 205-214
- Woody, R. W. (1995) Circular dichroism. Methods Enzymol.246, 34–71
- Manavalan, p., Johnson, W., Variable Selection Method Improves the Prediction of Protein Secondary Structure from Circular Dichroism Spectra, (1987), Analystical Biochemistry 167 76-85
- Brahms, S., Brahms, J., Determination of protein secondary structure in solution by vacuum ultraviolet circular dichroism, (1980), Journal of Molecular Biology, Volume 138, Issue 2, Pages 149-178
- Provencher, S.W., Glöckner, J., Estimation of globular protein secondary structure from circular dichroism, (1981), Biochemistry, Jan 6, 20(1):33-7, doi: 10.1021/bi00504a006
- Hennessey Jr, J.P., Johnson Jr, W.C., Information content in the circular dichroism of proteins, (1981), Biochemistry, Mar 3;20(5):1085-94,doi: 10.1021/bi00508a007
- Sreerama, N.,Woody, R.W., Protein secondary structure from circular dichroism spectroscopy. Combining variable selection principle and cluster analysis with neural network, ridge regression and self-consistent methods, (1994), J Mol Biol., Sep 30, 242(4), 497-507, doi: 10.1006/jmbi.1994.1597
- Venyaminov, S., Vassilenko, K. S., Determination of protein tertiary structure class from circular dichroism spectra, (1994), Anal. Biochem.222: 176–184
- Waterhous, D.V., Johnson Jr, W.C., Importance of environment in determining secondary structure in proteins, (1994), Biochemistry, Mar 1;33(8):2121-8, doi: 10.1021/bi00174a019