Fourier-transform infrared spectroscopy (FTIR)
Fourier-transform infrared spectroscopy (FTIR)[1] is a technique used to obtain an infrared spectrum of absorption or emission of a solid, liquid or gas. An FTIR spectrometer simultaneously collects high-spectral-resolution data over a wide spectral range. This represents a significant advantage over a dispersive spectrometer, which measures intensity over a narrow range of wavelengths at a time. Fourier-transform infrared spectroscopy got its name because it utilizes a Fourier transform (a mathematical process) that is required to convert the raw data into the actual spectrum. Fourier-transform spectroscopy is an absorption spectroscopy, in this technique a beam containing many frequencies of light used at once and measures how much of that beam is absorbed by the sample.
The source of polychromatic light in FTIR instruments is usually a continuous infrared radiation which consist of an inert solid that is electrically heated to a temperature between 1,500 and 2,200 K. The heated material will then emit infra red radiation. FTIR spectrometers are mostly used for measurements in the mid and near IR regions. For the mid-IR region, 2−25 μm (5000–400 cm−1), the most common source is a silicon carbide element heated to about 1200 K (Globar). The output is similar to a blackbody. Shorter wavelengths of the near-IR, 1−2.5 μm (10000–4000 cm−1), require a higher temperature source, typically a tungsten-halogen lamp. The long wavelength output of these is limited to about 5 μm (2000 cm−1) by the absorption of the quartz envelope. For the far-IR, especially at wavelengths beyond 50 μm (200 cm−1) a mercury discharge lamp gives higher output than a thermal source.[2]
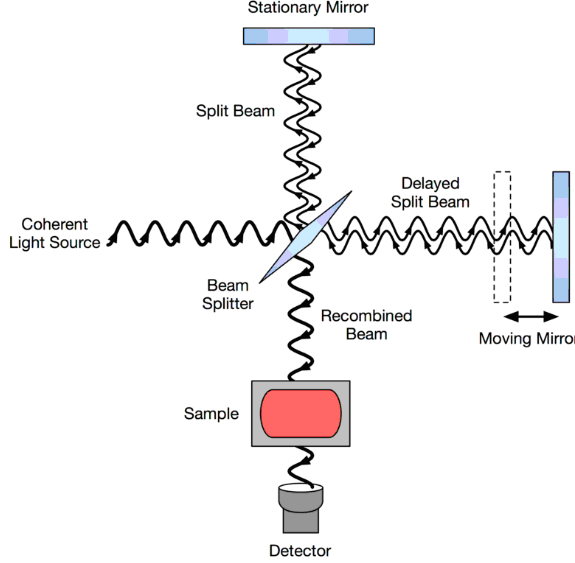
Polychcromatic light from one of the sources described above shines into a Michelson interferometer—a certain configuration of mirrors, one of which is moved by a motor. In a Michelson interferometer adapted for FTIR, light from the polychromatic infrared source, approximately a black-body radiator, is collimated and directed to a beam splitter. Ideally 50% of the light is refracted towards the fixed mirror and 50% is transmitted towards the moving mirror. Light is reflected from the two mirrors back to the beam splitter and some fraction of the original light passes into the sample compartment. There, the light is focused on the sample. On leaving the sample compartment the light is refocused on to the detector. The difference in optical path length between the two arms to the interferometer is known as the retardation or optical path difference (OPD). An interferogram (resulted raw data) is obtained by varying the retardation and recording the signal from the detector for various values of the retardation. The interferogram has to be measured from zero path difference to a maximum length that depends on the resolution required. The interferogram is converted to a spectrum by Fourier transformation.
Schematic diagram of a Michelson interferometer, configured for FTIR
Fourier transformation
Computer processing is required to turn the raw data (light absorption for each mirror position) into the desired result (light absorption for each wavelength). The processing done with a common algorithm called the Fourier transform. The Fourier transform converts one domain (in this case displacement of the mirror in cm) into its inverse domain (wavenumbers in cm−1).
FTIR spectrometers commonly use such detectors as either deuterated triglycine sulfate (DTGS) or liquid nitrogen cooled mercury cadmium telluride (MCT). DTGS operates at ambient temperatures and provide adequate sensitivity for most routine applications. With MCT detectors an interferogram can be measured in as little as 10 milliseconds.
Samples measurements in FTIR can be done in transmission mode (liquid samples) or reflectance (liquids and solids). Attenuated total reflectance (ATR) is a special accessory unit which can be used with Fourier transform infrared (FTIR) spectrometers. It allows to measure directly onto a solid state sample surface by pressing the sample towards an ATR crystal (e.g. diamond), including liquid and gas samples, thus avoiding the need to prepare pellets (small concentration of sample in e.g. KBr, mechanically and/or chemically dissolved) for use in the normal transmittance mode.
For the past 20 years FTIR became a good alternative for determining secondary protein structure[3,4,5]. This method can acquire spectra in many environments and across various different protein sizes. It is also quicker and requires less sample preparation than most other techniques. Characteristic absorption bands occur from various structural areas in the protein and this information can be interpreted to determine the secondary structure. This secondary structure, of which the beta-sheet and alpha-helix form the main components, is the most vital aspect of a protein’s structure.
The amide I bands derived using FTIR spectroscopy provide information on C=O bonding, while the amide II bands provide information on N-H bonding. This gives valuable insights regarding the secondary structure, as both of these forms of bonding are influenced by the protein’s secondary structural content. Amide I bands, especially, are sensitive to this secondary structure.
FTIR spectroscopy is also valuable for the study of protein stability. This includes the folding and unfolding processes under various thermal and chemical conditions and the protein aggregation process, which has been often studied in Huntington’s, Alzheimer’s, Parkinson’s and other amyloid diseases. Furthermore, FTIR spectroscopy discovers data on protein side-chains – the sequence of R groups that are part of and distinguish the amino acids present in a polypeptide chain.
The ability to obtain quantitative secondary structure information from FTIR spectra is of particular value when a fast approximate result is of interest, or when no other technique is available, such as the case with membrane-bound proteins. The analysis methods currently used are either based on band narrowing and curve fitting of the amide I band (frequency-based approach), or on the principle of pattern recognition, such as factor analysis or the partial least squares method [6-9]. The pattern recognition method is based on the work of Pancoska and Keiderling[10]. Factor analysis program predicts percent secondary structure of an unknown protein based on a database of proteins for which the detailed crystal structures are known. The detailed x-ray data is then correlated to FTIR spectra collected for these proteins. This data set becomes a calibration set. For a protein with an unknown structure, the FTIR is measured, and based on the calibration set above, the structure is determined.
References:
- Griffiths, P.; de Hasseth, J. A. (18 May 2007). Fourier Transform Infrared Spectrometry(2nd ed.). Wiley-Blackwell. ISBN 978-0-471-19404-0.
- Smith, D.R.; Morgan, R.L.; Loewenstein, E.V. (1968). “Comparison of the Radiance of Far-Infrared Sources”. J. Opt. Soc. Am. 58(3): 433–434. doi:1364/JOSA.58.000433.
- Jackson, M., Mantsch, H.H. The use and misuse of FTIR spectroscopy in the determination of protein structure, Crit. Rev. Biochem. Mol. Biol. (1995) 30, 95-120
- Gallagher W. FTIR Analysis of Protein Structure. Available at: http://www.chem.uwec.edu/Chem455_S05/Pages/Manuals/FTIR_of_proteins.pdf. Accessed: May 2016.
- Kong J & Yu S. Fourier Transform Infrared Spectroscopy Analysis of Protein Secondary Structures. Acta Biochimica et Biophysica Sinica 2007; 39: 549-559
- Susi, H., and Byler, D. M. Methods Enzymol. 1986, 130, 290
- Surewicz, W. K., and Mantsch, H. H. Biochim et Biophys. Acta 1988, 952, 115
- Surewicz, W. K., Mantsch, H. H., and Chapman, D. Biochemistry 1993, 32, 389
- Arrondo, J. L. R., Muga, A., Castresana, J., and Goni, F. M. In Biophys. Molec. Biol. 1993, 59, 23
- Pancoska, P., Yasui, S. C., and Keiderling, T. A. Biochemistry 1991, 30, 5089